

LUCI philosophy of sampling design
On why using catchment properties in sampling design makes your analysis statistically stronger
Based on the idea that anthropogenic emissions to surface waters are related to land use or specific activities in a catchment, monitoring that is designed to show a causal relationship between human activities and material loads need to fulfil two requirements:
- Loads need to be accurate and time-integrative over a certain period
- A gradient of the impacting human activity needs to be covered to establish the relationship
The latter is the goal of the LUCI-approach.

Example 1
Average pharmaceutical emissions per population equivalent (immission approach)
For instance, if you want to delineate the average pharmaceutical emissions per inhabitant to surface waters, you need to cover a gradient of population equivalent contributions to your surface water in a series of monitoring points. A plot of these loads against population equivalents will yield a regression whose slope represents load/PE.

Example 2
Nitrate emissions from arable land
If you want to know what the average nitrate emissions of arable land are within a region, monitoring points will need to be chosen according to fraction of arable land in each catchment. The plot of specific nitrate load (per ha) against arable land fraction will yield a regression whose slope of NO3-load/ha/fraction arable land. This slope multiplied by 100 represents one ha arable land and the average nitrate emission of the latter.
In both cases it is important to have a broad and equilibrated distribution of human activity/land use gradient to yield a strong regression.
This can only be achieved by consciously selecting points with different land use properties. Regulatory monitoring points are often situated at confluence and only represent average land use properties. Extreme properties are often missing and are hence making the regression weak or inexistent.
LUCI helps exactly here: choosing the points with different parameter features by filtering land use properties and showing the relevant sampling locations.
Often multiple criteria play and several filters are needed, for example if you want to analyse the impact of land use (like arable land fraction) within a specific hydrogeology and without any relevant waste water impact. LUCI offers this possibility.
Another important feature: monitoring points are statistically really independent: Often sampling points are within longitudinal profiles and therefore autocorrelated. With LUCI it is possible to choose totally independent sampling points with the same land use/human activity properties.
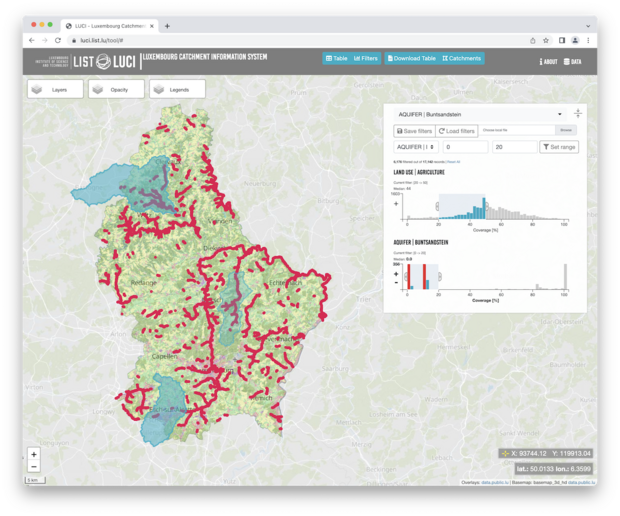
The Tool
How LUCI uses multiple filters to select statistically independent and undisturbed sampling locations
LUCI is a browser-based app which makes use of a modern, fluid, and responsive UI to instantly select river catchments based on their properties. Filter elements are integrated and combined next to a map view to instantly get the active selection of catchments. The visualization of the current filter combination is rendered instantly which makes it easy to spot suitable sampling locations on-the-fly. Filter settings are visualized with histogram charts and can be modified interactively.
Combinations of filters and settings can be exported, modified and exchanged between collaborators.

An application example
Using LUCI to find out about soils, land use and nitrate emissions in a landscape
Here’s an example on how LUCI can help to understand the landscape relationships and its impact on nitrate leaching. The initial question was: can we characterize the impact of land use on nitrate emission at base-flow in the Luxembourg-Sandstone region of Müllerthal with the black and white Ernz as main rivers.
LUCI was used to select monitoring points in the river network in a way that a) wastewater treatment plant impact was minimal b) a gradient of agricultural land use fraction would be sampled c) the hydrogeology would be represented in a balanced way (gradients between marls and sandstone).
The sampling points were chosen accordingly and a base-flow sampling with nitrate concentration determination conducted.
Figure one shows the results: Agricultural land use increases with lower Sandstone fraction (a). Heavier soils are preferred for agriculture. Agriculture is 2/3 green land and this ratio is pretty constant (b). There are two groups of sampling sites. One group that spans a wider range of agricultural use and shows a linear relationship with nitrate emissions and a second group at higher agricultural use that shows low nitrate emission around 20 mg/L (c). This latter group is situated in the marls (lower sandstone fraction) while the linear relationship is in the sandstone dominated catchments (d).
Following the linear regression, agricultural surfaces in the sandstone dominated regions have an emission of 45 mg/L while the background lies at 22 mg/L (c). Marl dominated catchment have lower emissions with nitrate values around 20 mg/L. These results seem to be driven largely by soil/aquifer permeability and the consequent pollution level of ground waters at base flow. This shows how a well-planned LUCI assisted monitoring can provide meaningful results with very little costs (1 small sampling campaign at baseflow).

Background data
What kind of data does LUCI use to optimize sampling design?
The catchment and most basic filters of LUCI rely on open public data sets such as a Digital Elevation Model (DEM) and e.g., land use, land cover, geology, and soil types. More specialized filters like about run-off or the pressure by wastewater treatment plants need dedicated data sets which are available from various sources.
The underlying data set is precalculated by a dedicated GIS (Geographic Information Systems) algorithm and is fed into LUCI. It was developed in the framework of LUCI.
We can help to identify different topics of filters and source the related data files and include them in the processing.